PSAT Math Multiple-Choice Practice Question 816
Question: 816
The Asian carp has experienced a rapid growth by displacing other fish in the Mississippi River. A researcher gathered three yearly samples from a 500-meter length of the Upper Mississippi River to determine the population trend of the fish over a decade.
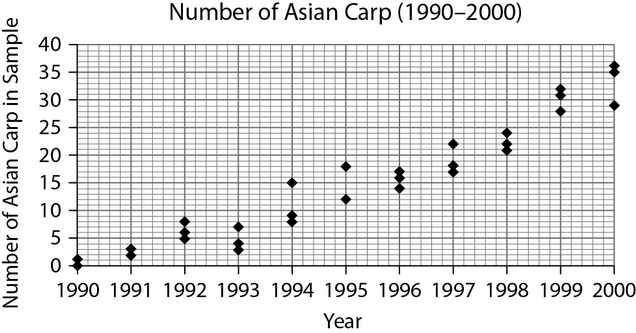
What is the approximate slope of the best-fit line of the data in the graph, expressed as 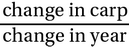
Correct Answer: A
Explanation:
(A) Some approximate points that would be on the best-fit line are (1990, 0) and (1996, 18). Calculate the approximate slope: 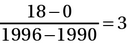 , which comes closest to choice (A).
You can also visualize this by drawing the approximate best-fit line on the graph:

More Tests
- PSAT Math Multiple-Choice Test 1
- PSAT Math Multiple-Choice Test 2
- PSAT Math Multiple-Choice Test 3
- PSAT Math Multiple-Choice Test 4
- PSAT Math Multiple-Choice Test 5
- PSAT Math Multiple-Choice Test 6
- PSAT Math Multiple-Choice Test 7
- PSAT Math Multiple-Choice Test 8
- PSAT Math Multiple-Choice Test 9
- PSAT Math Multiple-Choice Test 10
- PSAT Math Multiple-Choice Test 11
- PSAT Math Multiple-Choice Test 12
- PSAT Math Multiple-Choice Test 13
- PSAT Math Multiple-Choice Test 14
- PSAT Math Multiple-Choice Test 15
- PSAT Math Multiple-Choice Test 16
- PSAT Math Multiple-Choice Test 17
- PSAT Math Multiple-Choice Test 18
- PSAT Math Multiple-Choice Test 19
- PSAT Math Multiple-Choice Test 20
- PSAT Math Multiple-Choice Test 21
- PSAT Math Multiple-Choice Test 22
- PSAT Math Multiple-Choice Test 23
- PSAT Math Multiple-Choice Test 24
- PSAT Math Multiple-Choice Test 25