PSAT Math Multiple-Choice Question 800: Answer and Explanation
Question: 800
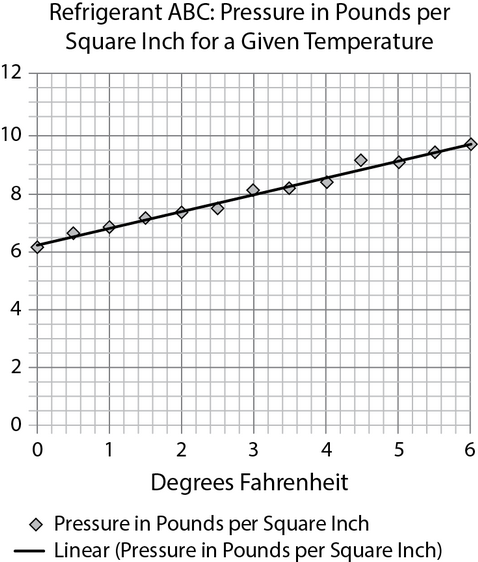
A refrigerant manufacturer recorded the pressure associated with certain temperatures in a refrigerator using its new refrigerant, ABC. Which equation best approximates the best-fit line portrayed by the data in this graph, using P for pressure, T for temperature, and the same units as portrayed in the graph?
- A. P = 0.5T + 6.2
- B. P = T + 6.2
- C. P = 0.5T - 3
- D. P = 7T + 5
Correct Answer: A
Explanation:
(A) The y-intercept of the function is somewhere between positive 6 and 8, so we can eliminate choices (C) and (D). Next, find the slope. You can use any 2 points on the line of best fit, such as the endpoints:
So the answer is choice (A). The line has a slope of 0.5 and a y-intercept of 6.2.
Test Information
- Use your browser's back button to return to your test results.
- Do more Math Multiple-Choice Tests tests.
More Tests
- PSAT Math Multiple-Choice Test 1
- PSAT Math Multiple-Choice Test 2
- PSAT Math Multiple-Choice Test 3
- PSAT Math Multiple-Choice Test 4
- PSAT Math Multiple-Choice Test 5
- PSAT Math Multiple-Choice Test 6
- PSAT Math Multiple-Choice Test 7
- PSAT Math Multiple-Choice Test 8
- PSAT Math Multiple-Choice Test 9
- PSAT Math Multiple-Choice Test 10
- PSAT Math Multiple-Choice Test 11
- PSAT Math Multiple-Choice Test 12
- PSAT Math Multiple-Choice Test 13
- PSAT Math Multiple-Choice Test 14
- PSAT Math Multiple-Choice Test 15
- PSAT Math Multiple-Choice Test 16
- PSAT Math Multiple-Choice Test 17
- PSAT Math Multiple-Choice Test 18
- PSAT Math Multiple-Choice Test 19
- PSAT Math Multiple-Choice Test 20
- PSAT Math Multiple-Choice Test 21
- PSAT Math Multiple-Choice Test 22
- PSAT Math Multiple-Choice Test 23
- PSAT Math Multiple-Choice Test 24
- PSAT Math Multiple-Choice Test 25