PSAT Math Multiple-Choice Practice Question 783
Question: 783
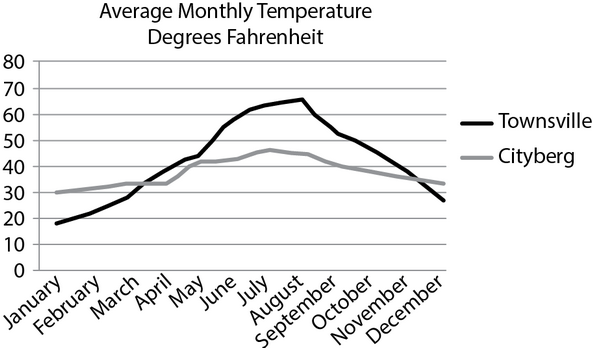
The average monthly temperatures for the cities of Townsville and Cityberg were recorded in the last calendar year. Based on the graph, which statement is true?
Correct Answer: C
Explanation:
(C) From the graph, we can tell that the average monthly temperature in Townsville is greater than that in Cityberg for April, May, June, July, August, September, October, and November, or eight months. Therefore, choice (C) is correct. Choices (A) and (B) are incorrect because the graph doesn't tell us anything about the temperature on any random day. Choice (D) is incorrect because the average temperature in Cityberg is greater only in January, February, March, and December.
More Tests
- PSAT Math Multiple-Choice Test 1
- PSAT Math Multiple-Choice Test 2
- PSAT Math Multiple-Choice Test 3
- PSAT Math Multiple-Choice Test 4
- PSAT Math Multiple-Choice Test 5
- PSAT Math Multiple-Choice Test 6
- PSAT Math Multiple-Choice Test 7
- PSAT Math Multiple-Choice Test 8
- PSAT Math Multiple-Choice Test 9
- PSAT Math Multiple-Choice Test 10
- PSAT Math Multiple-Choice Test 11
- PSAT Math Multiple-Choice Test 12
- PSAT Math Multiple-Choice Test 13
- PSAT Math Multiple-Choice Test 14
- PSAT Math Multiple-Choice Test 15
- PSAT Math Multiple-Choice Test 16
- PSAT Math Multiple-Choice Test 17
- PSAT Math Multiple-Choice Test 18
- PSAT Math Multiple-Choice Test 19
- PSAT Math Multiple-Choice Test 20
- PSAT Math Multiple-Choice Test 21
- PSAT Math Multiple-Choice Test 22
- PSAT Math Multiple-Choice Test 23
- PSAT Math Multiple-Choice Test 24
- PSAT Math Multiple-Choice Test 25