PSAT Math Multiple-Choice Question 70: Answer and Explanation
Question: 70
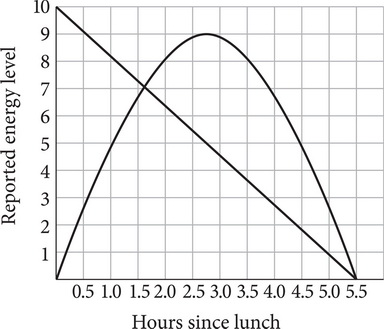
Two employees at a certain company were asked to gauge their energy levels on a scale of 1 to 10 after eating lunch at noon. The results were averaged and plotted as illustrated in the above figure. Which of the following statements is most consistent with the given data?
- A. Both employees experienced the same fluctuation in energy during the afternoon hours.
- B. Both employees were drowsy after eating big lunches.
- C. One of the employees consumed energy-boosting foods and drinks and became less energetic throughout the afternoon.
- D. One of the employees consumed foods that resulted in her feeling more energetic throughout the day.
Correct Answer: C
Explanation:
C
The question asks for a statement that is consistent with the data shown in a graph. Compare features of the graph to the answer choices and use Process of Elimination. Choice (A) is not supported by the graph because one employee had a linear decrease in energy, while the other employee's energy increased and decreased in an exponential fashion; eliminate (A). Choice (B) is also not supported; one employee had low energy after lunch, but the other employee had the highest energy level immediately after lunch. Eliminate (B). Choice (C) fits the employee who started with high energy and decreased throughout the afternoon; keep (C). Choice (D) fits neither employee: one employee's energy decreased throughout the afternoon, and the other employee's energy increased and then rapidly decreased. Eliminate (D). The correct answer is (C).
Test Information
- Use your browser's back button to return to your test results.
- Do more Math Multiple-Choice Tests tests.
More Tests
- PSAT Math Multiple-Choice Test 1
- PSAT Math Multiple-Choice Test 2
- PSAT Math Multiple-Choice Test 3
- PSAT Math Multiple-Choice Test 4
- PSAT Math Multiple-Choice Test 5
- PSAT Math Multiple-Choice Test 6
- PSAT Math Multiple-Choice Test 7
- PSAT Math Multiple-Choice Test 8
- PSAT Math Multiple-Choice Test 9
- PSAT Math Multiple-Choice Test 10
- PSAT Math Multiple-Choice Test 11
- PSAT Math Multiple-Choice Test 12
- PSAT Math Multiple-Choice Test 13
- PSAT Math Multiple-Choice Test 14
- PSAT Math Multiple-Choice Test 15
- PSAT Math Multiple-Choice Test 16
- PSAT Math Multiple-Choice Test 17
- PSAT Math Multiple-Choice Test 18
- PSAT Math Multiple-Choice Test 19
- PSAT Math Multiple-Choice Test 20
- PSAT Math Multiple-Choice Test 21
- PSAT Math Multiple-Choice Test 22
- PSAT Math Multiple-Choice Test 23
- PSAT Math Multiple-Choice Test 24
- PSAT Math Multiple-Choice Test 25