PSAT Math Multiple-Choice Question 68: Answer and Explanation
Question: 68
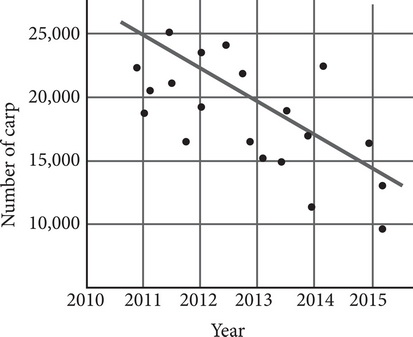
Between 2010 and 2015, researchers tracked populations of Crucian carp in the Ohio River. The graph above displays population sizes as counted by the researchers. According to the line of best fit, what is the approximate average yearly decrease in the number of Crucian carp?
- A. 1
- B. 2.5
- C. 1,200
- D. 2,500
Correct Answer: D
Explanation:
D
The question asks for approximate average yearly decrease in the number of Crucian carp based on the line of best fit shown in the graph. In this graph, the slope of the line of best fit represents the average yearly change. To formula for slope is  . Choose two points from the graph to plug into the slope formula. On the graph, the number of carp in 2010 was 25,000 and in 2011, the number of carp was 22,500. Using these x- and y-values, the expression becomes
  . Simplify the expression to get
  , or -2,500. Since the result is negative, it represents a decrease of 2,500 carp per year. The correct answer is (D).
Test Information
- Use your browser's back button to return to your test results.
- Do more Math Multiple-Choice Tests tests.
More Tests
- PSAT Math Multiple-Choice Test 1
- PSAT Math Multiple-Choice Test 2
- PSAT Math Multiple-Choice Test 3
- PSAT Math Multiple-Choice Test 4
- PSAT Math Multiple-Choice Test 5
- PSAT Math Multiple-Choice Test 6
- PSAT Math Multiple-Choice Test 7
- PSAT Math Multiple-Choice Test 8
- PSAT Math Multiple-Choice Test 9
- PSAT Math Multiple-Choice Test 10
- PSAT Math Multiple-Choice Test 11
- PSAT Math Multiple-Choice Test 12
- PSAT Math Multiple-Choice Test 13
- PSAT Math Multiple-Choice Test 14
- PSAT Math Multiple-Choice Test 15
- PSAT Math Multiple-Choice Test 16
- PSAT Math Multiple-Choice Test 17
- PSAT Math Multiple-Choice Test 18
- PSAT Math Multiple-Choice Test 19
- PSAT Math Multiple-Choice Test 20
- PSAT Math Multiple-Choice Test 21
- PSAT Math Multiple-Choice Test 22
- PSAT Math Multiple-Choice Test 23
- PSAT Math Multiple-Choice Test 24
- PSAT Math Multiple-Choice Test 25