PSAT Math Multiple-Choice Practice Question 645
Question: 645
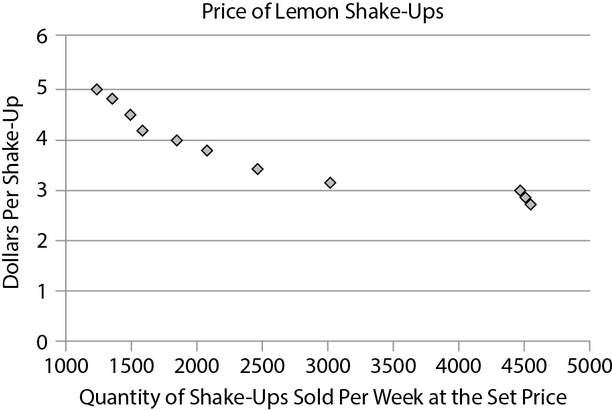
If you were to graph dollars per shake-up along the x-axis and quantity of shake-ups sold per week at the set price on the y-axis, which of the following would be a property of the function between the values of 3 and 5 dollars?
Correct Answer: A
Explanation:
(A) We can see from the negative slope that as the quantity of shake-ups increases, price decreases. Therefore, we know that the function will be decreasing, eliminating choices (B) and (D). We can also see that the slope isn't constant. Therefore, it can't be linear, as in choice (C). The graph starts off fairly steep and then it becomes less steep, consistent with exponential decay, as in choice (A).
More Tests
- PSAT Math Multiple-Choice Test 1
- PSAT Math Multiple-Choice Test 2
- PSAT Math Multiple-Choice Test 3
- PSAT Math Multiple-Choice Test 4
- PSAT Math Multiple-Choice Test 5
- PSAT Math Multiple-Choice Test 6
- PSAT Math Multiple-Choice Test 7
- PSAT Math Multiple-Choice Test 8
- PSAT Math Multiple-Choice Test 9
- PSAT Math Multiple-Choice Test 10
- PSAT Math Multiple-Choice Test 11
- PSAT Math Multiple-Choice Test 12
- PSAT Math Multiple-Choice Test 13
- PSAT Math Multiple-Choice Test 14
- PSAT Math Multiple-Choice Test 15
- PSAT Math Multiple-Choice Test 16
- PSAT Math Multiple-Choice Test 17
- PSAT Math Multiple-Choice Test 18
- PSAT Math Multiple-Choice Test 19
- PSAT Math Multiple-Choice Test 20
- PSAT Math Multiple-Choice Test 21
- PSAT Math Multiple-Choice Test 22
- PSAT Math Multiple-Choice Test 23
- PSAT Math Multiple-Choice Test 24
- PSAT Math Multiple-Choice Test 25