PSAT Math Multiple-Choice Question 537: Answer and Explanation
Question: 537
The rates to book a private tour with a company are shown below.
Private Tour Rates
(maximum of 24 participants)
| Price of tour ($) | Number of participants |
| 50 | up to 2 |
| 100 | more than 2 and no more than 4 |
| 150 | more than 4 and no more than 6 |
| 200 | more than 6 and no more than 12 |
| 225 | more than 12 and no more than 18 |
| 250 | more than 18 and no more than 24 |
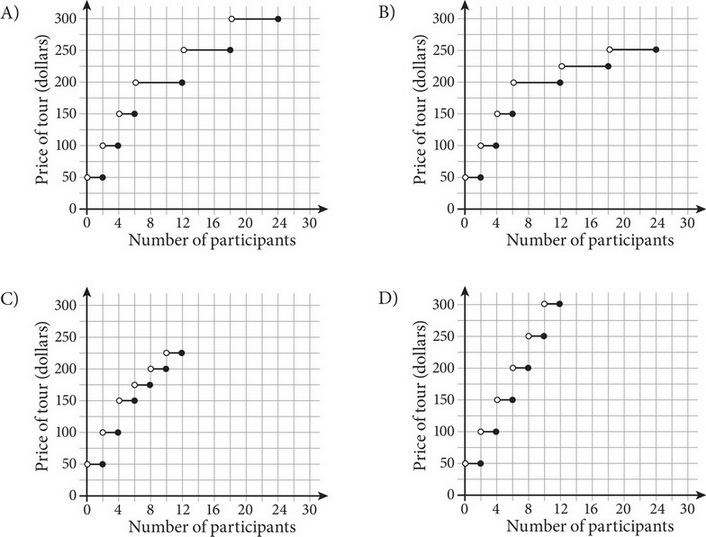
Which graph best represents the relationship between the number of participants and the total charge of the tour, in dollars?
- A. A
- B. B
- C. C
- D. D
Correct Answer: B
Explanation:
B
The question asks for the graph that best represents data in a table. Pick a piece of information from the table and use it to eliminate graphs in the answer choices. The graphs all look similar for small numbers of participants, so try a large number. If there are 20 participants, the price of the tour is $250. The numbers for Tour participants are listed along the horizontal axis in each answer, so find 20 on that axis. From this point, trace up to find the intersection with the graph, using the answer sheet as a straight edge if necessary. For (A), it is on the gridline for $300. This does not match the target value of $250, so eliminate (A). For (B), it is on the gridline for $250, so keep (B), but check the remaining answers just in case. For (C) and (D), there is no price indicated for 20 tour participants, so eliminate (C) and (D). The correct answer is (B).
Test Information
- Use your browser's back button to return to your test results.
- Do more Math Multiple-Choice Tests tests.
More Tests
- PSAT Math Multiple-Choice Test 1
- PSAT Math Multiple-Choice Test 2
- PSAT Math Multiple-Choice Test 3
- PSAT Math Multiple-Choice Test 4
- PSAT Math Multiple-Choice Test 5
- PSAT Math Multiple-Choice Test 6
- PSAT Math Multiple-Choice Test 7
- PSAT Math Multiple-Choice Test 8
- PSAT Math Multiple-Choice Test 9
- PSAT Math Multiple-Choice Test 10
- PSAT Math Multiple-Choice Test 11
- PSAT Math Multiple-Choice Test 12
- PSAT Math Multiple-Choice Test 13
- PSAT Math Multiple-Choice Test 14
- PSAT Math Multiple-Choice Test 15
- PSAT Math Multiple-Choice Test 16
- PSAT Math Multiple-Choice Test 17
- PSAT Math Multiple-Choice Test 18
- PSAT Math Multiple-Choice Test 19
- PSAT Math Multiple-Choice Test 20
- PSAT Math Multiple-Choice Test 21
- PSAT Math Multiple-Choice Test 22
- PSAT Math Multiple-Choice Test 23
- PSAT Math Multiple-Choice Test 24
- PSAT Math Multiple-Choice Test 25