PSAT Math Multiple-Choice Question 536: Answer and Explanation
Question: 536
A scientist at a greenhouse studied the relationship between the growth rate of a particular tree species and its current height. The conditions in the greenhouse were kept constant throughout the study period. The results are shown below, along with the graph of the exponential function that best models the data.
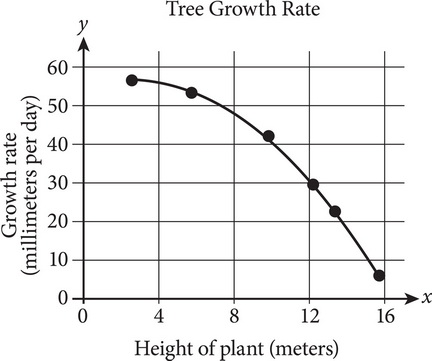
According to the model, which of the following is the best estimate of the plant’s growth rate, in millimeters per day, when the plant was 11 meters tall?
- A. 14
- B. 15
- C. 30
- D. 36
Correct Answer: D
Explanation:
D
The question asks for a certain value on a graph. Height is listed along the horizontal axis, so find 11 on that axis. It will be between the lines for 8 and 12, closer to the 12. From this point, trace up to find the intersection with the line of best fit, using the answer sheet as a straight edge if necessary. It is between the horizontal gridlines for 30 and 40 on the vertical Growth rate axis. Only the value in (D) falls between 30 and 40. The correct answer is (D).
Test Information
- Use your browser's back button to return to your test results.
- Do more Math Multiple-Choice Tests tests.
More Tests
- PSAT Math Multiple-Choice Test 1
- PSAT Math Multiple-Choice Test 2
- PSAT Math Multiple-Choice Test 3
- PSAT Math Multiple-Choice Test 4
- PSAT Math Multiple-Choice Test 5
- PSAT Math Multiple-Choice Test 6
- PSAT Math Multiple-Choice Test 7
- PSAT Math Multiple-Choice Test 8
- PSAT Math Multiple-Choice Test 9
- PSAT Math Multiple-Choice Test 10
- PSAT Math Multiple-Choice Test 11
- PSAT Math Multiple-Choice Test 12
- PSAT Math Multiple-Choice Test 13
- PSAT Math Multiple-Choice Test 14
- PSAT Math Multiple-Choice Test 15
- PSAT Math Multiple-Choice Test 16
- PSAT Math Multiple-Choice Test 17
- PSAT Math Multiple-Choice Test 18
- PSAT Math Multiple-Choice Test 19
- PSAT Math Multiple-Choice Test 20
- PSAT Math Multiple-Choice Test 21
- PSAT Math Multiple-Choice Test 22
- PSAT Math Multiple-Choice Test 23
- PSAT Math Multiple-Choice Test 24
- PSAT Math Multiple-Choice Test 25