PSAT Math Multiple-Choice Question 518: Answer and Explanation
Question: 518
A group of students observed that there was a relationship between the hours a petri dish was left to incubate and the resulting number of cells in the petri dish. The graph below displays their findings as well as a best-fit line drawn by one of the students.
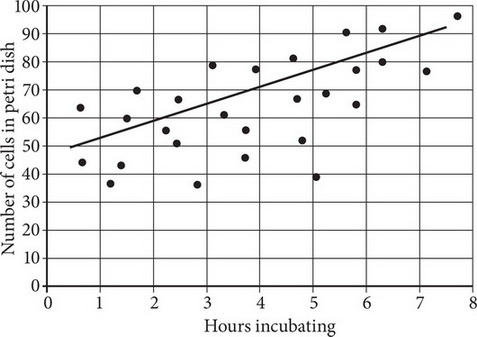
Which of the following is the correct approximate average hourly increase in the number of cells, based on the best-fit line in the graph?
- A. 0.06
- B. 0.43
- C. 6.00
- D. 92.00
Correct Answer: C
Explanation:
C
The question asks for the average hourly increase in the number of cells. When a question asks for a rate of change, it is asking about the slope of the graph. For slope questions, use the equation 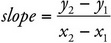 . Find two points on the best-fit line and plug them into the slope equation. Use the points (0, 50) and (5, 80), where y2 = 80, y1 = 50, x2 = 5, and x1 = 0. The slope is
  . The correct answer is (C).
Test Information
- Use your browser's back button to return to your test results.
- Do more Math Multiple-Choice Tests tests.
More Tests
- PSAT Math Multiple-Choice Test 1
- PSAT Math Multiple-Choice Test 2
- PSAT Math Multiple-Choice Test 3
- PSAT Math Multiple-Choice Test 4
- PSAT Math Multiple-Choice Test 5
- PSAT Math Multiple-Choice Test 6
- PSAT Math Multiple-Choice Test 7
- PSAT Math Multiple-Choice Test 8
- PSAT Math Multiple-Choice Test 9
- PSAT Math Multiple-Choice Test 10
- PSAT Math Multiple-Choice Test 11
- PSAT Math Multiple-Choice Test 12
- PSAT Math Multiple-Choice Test 13
- PSAT Math Multiple-Choice Test 14
- PSAT Math Multiple-Choice Test 15
- PSAT Math Multiple-Choice Test 16
- PSAT Math Multiple-Choice Test 17
- PSAT Math Multiple-Choice Test 18
- PSAT Math Multiple-Choice Test 19
- PSAT Math Multiple-Choice Test 20
- PSAT Math Multiple-Choice Test 21
- PSAT Math Multiple-Choice Test 22
- PSAT Math Multiple-Choice Test 23
- PSAT Math Multiple-Choice Test 24
- PSAT Math Multiple-Choice Test 25