PSAT Math Multiple-Choice Question 494: Answer and Explanation
Question: 494
A data set showing the relationship between two variables is graphed in the xy-plane to produce the scatterplot below. A line of best fit is generated and is shown on the graph.
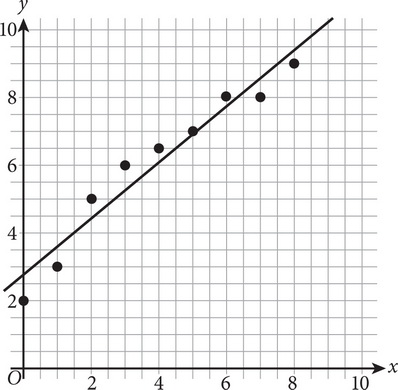
How much greater is the y-value of the data point at x = 4 than the y-value of the best fit line at the same x-value?
- A. 12.5
- B. 6.5
- C. 6.0
- D. 0.5
Correct Answer: D
Explanation:
D
The question asks for the difference between two values on a graph. The x-values are listed along the horizontal axis, so find 4 on that axis. From this point, trace up to find the intersection with the line of best fit, using the answer sheet as a straight edge if necessary. Trace left to find that this corresponds with 6 on the y-axis. Now, find the dot for the data point at x = 4 just above the line and trace left to find the y-value on the vertical axis. This is halfway between 6 and 7 on the y-axis, or 6.5. The difference is 6.5 – 6 = 0.5. The correct answer is (D).
Test Information
- Use your browser's back button to return to your test results.
- Do more Math Multiple-Choice Tests tests.
More Tests
- PSAT Math Multiple-Choice Test 1
- PSAT Math Multiple-Choice Test 2
- PSAT Math Multiple-Choice Test 3
- PSAT Math Multiple-Choice Test 4
- PSAT Math Multiple-Choice Test 5
- PSAT Math Multiple-Choice Test 6
- PSAT Math Multiple-Choice Test 7
- PSAT Math Multiple-Choice Test 8
- PSAT Math Multiple-Choice Test 9
- PSAT Math Multiple-Choice Test 10
- PSAT Math Multiple-Choice Test 11
- PSAT Math Multiple-Choice Test 12
- PSAT Math Multiple-Choice Test 13
- PSAT Math Multiple-Choice Test 14
- PSAT Math Multiple-Choice Test 15
- PSAT Math Multiple-Choice Test 16
- PSAT Math Multiple-Choice Test 17
- PSAT Math Multiple-Choice Test 18
- PSAT Math Multiple-Choice Test 19
- PSAT Math Multiple-Choice Test 20
- PSAT Math Multiple-Choice Test 21
- PSAT Math Multiple-Choice Test 22
- PSAT Math Multiple-Choice Test 23
- PSAT Math Multiple-Choice Test 24
- PSAT Math Multiple-Choice Test 25