PSAT Math Multiple-Choice Question 491: Answer and Explanation
Question: 491
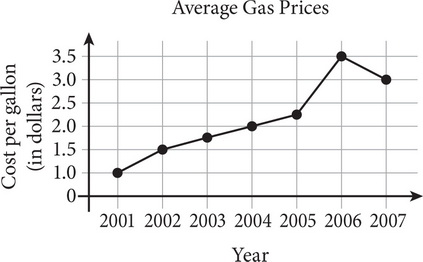
The average cost of a gallon of gas from 2000 to 2007 is displayed in the line graph above. How much more did a gallon of gas cost in 2007 than in 2003, according to the line graph?
- A. $1.00
- B. $1.25
- C. $1.75
- D. $3.00
Correct Answer: B
Explanation:
B
The question asks for the difference between two values on a graph. Years are listed along the horizontal axis, so find 2003 on that axis. Trace up to find the intersection with the graphed line. From this point, trace left to find the intersection with the vertical axis, using the answer sheet as a straight edge if necessary. It is between the horizontal gridlines for $1.50 and $2.00 on the Cost per Gallon axis, so ballpark this value as $1.75. Then, find 2007 on the horizontal axis. Trace up to the graphed line, then trace left to get a value of $3.00. The question asks for the difference, so subtract $3.00 – $1.75 to get $1.25. The correct answer is (B).
Test Information
- Use your browser's back button to return to your test results.
- Do more Math Multiple-Choice Tests tests.
More Tests
- PSAT Math Multiple-Choice Test 1
- PSAT Math Multiple-Choice Test 2
- PSAT Math Multiple-Choice Test 3
- PSAT Math Multiple-Choice Test 4
- PSAT Math Multiple-Choice Test 5
- PSAT Math Multiple-Choice Test 6
- PSAT Math Multiple-Choice Test 7
- PSAT Math Multiple-Choice Test 8
- PSAT Math Multiple-Choice Test 9
- PSAT Math Multiple-Choice Test 10
- PSAT Math Multiple-Choice Test 11
- PSAT Math Multiple-Choice Test 12
- PSAT Math Multiple-Choice Test 13
- PSAT Math Multiple-Choice Test 14
- PSAT Math Multiple-Choice Test 15
- PSAT Math Multiple-Choice Test 16
- PSAT Math Multiple-Choice Test 17
- PSAT Math Multiple-Choice Test 18
- PSAT Math Multiple-Choice Test 19
- PSAT Math Multiple-Choice Test 20
- PSAT Math Multiple-Choice Test 21
- PSAT Math Multiple-Choice Test 22
- PSAT Math Multiple-Choice Test 23
- PSAT Math Multiple-Choice Test 24
- PSAT Math Multiple-Choice Test 25