PSAT Math Multiple-Choice Question 488: Answer and Explanation
Question: 488
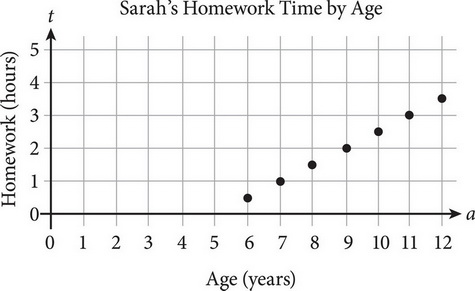
Sarah’s parents tracked the amount of time she spent on homework as she grew up. The scatterplot above shows how the amount of time t, in hours, Sarah spent on homework in relation to her age a, in years. Which of the following equations best models this data, where 6 ≤ a ≤ 12?
- A. t = –0.5a – 2.5
- B. t = –2.5a – 0.5
- C. t = 0.5a – 2.5
- D. t = 2.5a – 0.5
Correct Answer: C
Explanation:
C
The question asks for an equation that represents a graph. Pick a point that is on the graph and plug it into the answer choices to see which ones are true. The graph contains the point (7, 1), with 7 on the x-axis, so plug a = 7 and t = 1 into the answers. Eliminate answer choices that contain false equations. Choice (A) becomes 1 = –(0.5)(7) – 2.5, then 1 = –3.5 – 2.5, so 1 = –6. This is not true, so eliminate (A). Choice (B) becomes 1 = –(2.5)(7) – 0.5, then 1 = –17.5 – 0.5, or 1 = –18. Eliminate (B). Choice (C) becomes 1 = (0.5)(7) – 2.5, then 1 = 3.5 – 2.5, or 1 = 1. This is true, so keep (C), but check (D) just in case. Choice (D) becomes 1 = (2.5)(7) – 0.5, then 1 = 17.5 – 2.5, or 1 = 15. Eliminate (D). The correct answer is (C).
Test Information
- Use your browser's back button to return to your test results.
- Do more Math Multiple-Choice Tests tests.
More Tests
- PSAT Math Multiple-Choice Test 1
- PSAT Math Multiple-Choice Test 2
- PSAT Math Multiple-Choice Test 3
- PSAT Math Multiple-Choice Test 4
- PSAT Math Multiple-Choice Test 5
- PSAT Math Multiple-Choice Test 6
- PSAT Math Multiple-Choice Test 7
- PSAT Math Multiple-Choice Test 8
- PSAT Math Multiple-Choice Test 9
- PSAT Math Multiple-Choice Test 10
- PSAT Math Multiple-Choice Test 11
- PSAT Math Multiple-Choice Test 12
- PSAT Math Multiple-Choice Test 13
- PSAT Math Multiple-Choice Test 14
- PSAT Math Multiple-Choice Test 15
- PSAT Math Multiple-Choice Test 16
- PSAT Math Multiple-Choice Test 17
- PSAT Math Multiple-Choice Test 18
- PSAT Math Multiple-Choice Test 19
- PSAT Math Multiple-Choice Test 20
- PSAT Math Multiple-Choice Test 21
- PSAT Math Multiple-Choice Test 22
- PSAT Math Multiple-Choice Test 23
- PSAT Math Multiple-Choice Test 24
- PSAT Math Multiple-Choice Test 25