PSAT Math Multiple-Choice Question 469: Answer and Explanation
Question: 469
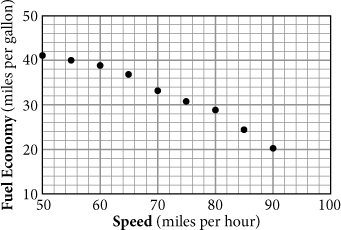
A car's fuel economy generally increases as its speed increases, but past a certain speed, it starts to drop, as depicted for a particular car in the graph above. What is the best estimate of this car's fuel economy, in miles per gallon, at 100 miles per hour?
- A. 0
- B. 10
- C. 17
- D. 41
Correct Answer: B
Explanation:
B
Difficulty: Easy
Category: Graphs of Quadratics
Getting to the Answer: Sketch a regression line on the graph. You'll notice it has a slight curve. Extending the regression line to the x-axis allows you to reasonably estimate what your fuel economy at 100 miles per hour (mph) will be. Notice that the miles per gallon (mpg) drop from 80 mph to 90 mph is slightly less than 10, so it is reasonable to expect a drop of another full 10 mpg as the curve steepens from 90 mph to 100 mph. Therefore, the mpg at 100 mph would be about 10, so (B) is correct.
Test Information
- Use your browser's back button to return to your test results.
- Do more Math Multiple-Choice Tests tests.
More Tests
- PSAT Math Multiple-Choice Test 1
- PSAT Math Multiple-Choice Test 2
- PSAT Math Multiple-Choice Test 3
- PSAT Math Multiple-Choice Test 4
- PSAT Math Multiple-Choice Test 5
- PSAT Math Multiple-Choice Test 6
- PSAT Math Multiple-Choice Test 7
- PSAT Math Multiple-Choice Test 8
- PSAT Math Multiple-Choice Test 9
- PSAT Math Multiple-Choice Test 10
- PSAT Math Multiple-Choice Test 11
- PSAT Math Multiple-Choice Test 12
- PSAT Math Multiple-Choice Test 13
- PSAT Math Multiple-Choice Test 14
- PSAT Math Multiple-Choice Test 15
- PSAT Math Multiple-Choice Test 16
- PSAT Math Multiple-Choice Test 17
- PSAT Math Multiple-Choice Test 18
- PSAT Math Multiple-Choice Test 19
- PSAT Math Multiple-Choice Test 20
- PSAT Math Multiple-Choice Test 21
- PSAT Math Multiple-Choice Test 22
- PSAT Math Multiple-Choice Test 23
- PSAT Math Multiple-Choice Test 24
- PSAT Math Multiple-Choice Test 25