PSAT Math Multiple-Choice Practice Question 404
Question: 404
The table below shows the distribution of applicants by age and level of education for a management trainee program offered at a retail store.
| Age Group | High School Diploma Only | 2-Year Degree | 4-Year Degree | Total |
|---|---|---|---|---|
| 18–25 | 23 | 12 | 3 | 38 |
| 26–35 | 16 | 19 | 9 | 44 |
| 36–45 | 11 | 13 | 2 | 26 |
| Older than 45 | 2 | 2 | 0 | 4 |
| Total | 52 | 46 | 14 | 112 |
 According to the data, which age group had the smallest percentage of people with a high school diploma only?
Correct Answer: B
Explanation:
B
Difficulty: Medium
Category: Tables and Graphs
Getting to the Answer: To calculate the percentage of people in each age group who had a high school diploma only, divide the number of people in that age group with only a high school diploma by the total number of applicants in that age group. Choice (B) is correct because 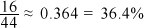 , which is a lower percentage than that of the other age groups (18 to 25 ≈ 60.5%, 36 to 45 ≈ 42.3%, and Older than 45 = 50%).
More Tests
- PSAT Math Multiple-Choice Test 1
- PSAT Math Multiple-Choice Test 2
- PSAT Math Multiple-Choice Test 3
- PSAT Math Multiple-Choice Test 4
- PSAT Math Multiple-Choice Test 5
- PSAT Math Multiple-Choice Test 6
- PSAT Math Multiple-Choice Test 7
- PSAT Math Multiple-Choice Test 8
- PSAT Math Multiple-Choice Test 9
- PSAT Math Multiple-Choice Test 10
- PSAT Math Multiple-Choice Test 11
- PSAT Math Multiple-Choice Test 12
- PSAT Math Multiple-Choice Test 13
- PSAT Math Multiple-Choice Test 14
- PSAT Math Multiple-Choice Test 15
- PSAT Math Multiple-Choice Test 16
- PSAT Math Multiple-Choice Test 17
- PSAT Math Multiple-Choice Test 18
- PSAT Math Multiple-Choice Test 19
- PSAT Math Multiple-Choice Test 20
- PSAT Math Multiple-Choice Test 21
- PSAT Math Multiple-Choice Test 22
- PSAT Math Multiple-Choice Test 23
- PSAT Math Multiple-Choice Test 24
- PSAT Math Multiple-Choice Test 25