PSAT Math Multiple-Choice Question 392: Answer and Explanation
Question: 392
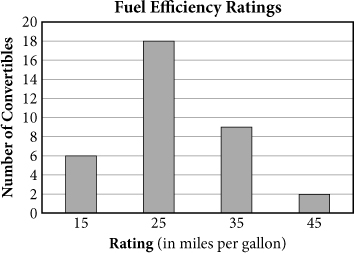
 The bar graph above shows the number of convertibles made by several manufacturers with various fuel efficiency ratings. What is the mean fuel efficiency rating for these convertibles?
- A. 25
- B. 27
- C. 30
- D. 32
Correct Answer: B
Explanation:
B
Difficulty: Easy
Getting to the Answer: The mean of a set of numbers is the same as the average, which is the sum of the values divided by the number of values. Use the graph to find the sum of the fuel efficiency ratings and then calculate the mean. To save time, multiply the frequency in each category by the rating and then divide by the total number of convertibles: (6 × 15) + (18 × 25) + (9 × 35) + (2 × 45) = 945, and there are 6 + 18 + 9 + 2 = 35 total convertibles, so  . Choice (B) is correct.
Test Information
- Use your browser's back button to return to your test results.
- Do more Math Multiple-Choice Tests tests.
More Tests
- PSAT Math Multiple-Choice Test 1
- PSAT Math Multiple-Choice Test 2
- PSAT Math Multiple-Choice Test 3
- PSAT Math Multiple-Choice Test 4
- PSAT Math Multiple-Choice Test 5
- PSAT Math Multiple-Choice Test 6
- PSAT Math Multiple-Choice Test 7
- PSAT Math Multiple-Choice Test 8
- PSAT Math Multiple-Choice Test 9
- PSAT Math Multiple-Choice Test 10
- PSAT Math Multiple-Choice Test 11
- PSAT Math Multiple-Choice Test 12
- PSAT Math Multiple-Choice Test 13
- PSAT Math Multiple-Choice Test 14
- PSAT Math Multiple-Choice Test 15
- PSAT Math Multiple-Choice Test 16
- PSAT Math Multiple-Choice Test 17
- PSAT Math Multiple-Choice Test 18
- PSAT Math Multiple-Choice Test 19
- PSAT Math Multiple-Choice Test 20
- PSAT Math Multiple-Choice Test 21
- PSAT Math Multiple-Choice Test 22
- PSAT Math Multiple-Choice Test 23
- PSAT Math Multiple-Choice Test 24
- PSAT Math Multiple-Choice Test 25