PSAT Math Multiple-Choice Question 385: Answer and Explanation
Question: 385
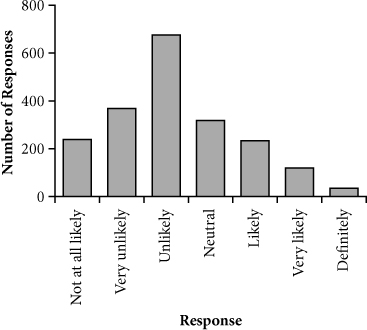
Liam is conducting a market research study to determine the effectiveness of advertisements on social networking sites. He surveyed a randomly selected group of 2,000 young adults on how likely they are to purchase from a company based on its advertisements on social networking sites. Respondents rated their likelihood to purchase on a scale from 1 to 7, with 1 being "Not at all likely" and 7 being "Definitely." The results are summarized in the bar graph above. Which of the following statements is NOT true based on the survey results?
- A. mode = 3
- B. median = 3
- C. mean < median
- D. 2 < mean < 5
Correct Answer: C
Explanation:
C
Difficulty: Medium
Category: Statistics
Getting to the Answer: Examine the bar chart to evaluate the choices.
(A): The bar for "Unlikely" (which is 3 on the scale given in the question) is clearly the tallest, so this is the mode. Eliminate (A).
(B): There are 2,000 responses, so the median is the average of responses 1,000 and 1,001. The total of the first two bars is about 600. Since the third bar is about 700, that means that the median response is indeed within this bar. Eliminate (B).
(C): The data is skewed to the right, meaning that the extreme values on the right will weight the mean calculation to make the mean greater than the median. Thus, (C) is not true and is the correct choice.
(D): If you were not certain that (C) was the correct choice, you could see that the substantial majority of values are between 2 and 5 inclusive, so the mean has to be somewhere within that wide range. Eliminating (D) confirms (C) as correct.
Test Information
- Use your browser's back button to return to your test results.
- Do more Math Multiple-Choice Tests tests.
More Tests
- PSAT Math Multiple-Choice Test 1
- PSAT Math Multiple-Choice Test 2
- PSAT Math Multiple-Choice Test 3
- PSAT Math Multiple-Choice Test 4
- PSAT Math Multiple-Choice Test 5
- PSAT Math Multiple-Choice Test 6
- PSAT Math Multiple-Choice Test 7
- PSAT Math Multiple-Choice Test 8
- PSAT Math Multiple-Choice Test 9
- PSAT Math Multiple-Choice Test 10
- PSAT Math Multiple-Choice Test 11
- PSAT Math Multiple-Choice Test 12
- PSAT Math Multiple-Choice Test 13
- PSAT Math Multiple-Choice Test 14
- PSAT Math Multiple-Choice Test 15
- PSAT Math Multiple-Choice Test 16
- PSAT Math Multiple-Choice Test 17
- PSAT Math Multiple-Choice Test 18
- PSAT Math Multiple-Choice Test 19
- PSAT Math Multiple-Choice Test 20
- PSAT Math Multiple-Choice Test 21
- PSAT Math Multiple-Choice Test 22
- PSAT Math Multiple-Choice Test 23
- PSAT Math Multiple-Choice Test 24
- PSAT Math Multiple-Choice Test 25