PSAT Math Multiple-Choice Question 315: Answer and Explanation
Question: 315
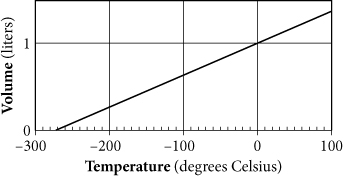
The graph above shows the volume of a sample of gas as it is cooled. If T is the temperature of the gas in degrees Celsius and V is the volume in liters, which of the following equations, when plotted, could produce the graph shown?
- A. V = 0.004T + 100
- B. V = 0.004T
- C. V = 0.004T + 1
- D. V = 0.004T - 0.25
Correct Answer: C
Explanation:
C
Difficulty: Medium
Getting to the Answer: Temperature, T, is the independent variable on the x-axis, and volume, V, is the dependent variable on the y-axis. Therefore, the skeleton of the equation you're looking for is V = mT + b. Because each answer choice has a different y-intercept, finding b is enough to get the correct answer; there is no need to determine the slope. Although the graph is not centered around the origin, you can still find the y-intercept. In this case, it's 1. This eliminates every answer choice except (C), which is correct.
Test Information
- Use your browser's back button to return to your test results.
- Do more Math Multiple-Choice Tests tests.
More Tests
- PSAT Math Multiple-Choice Test 1
- PSAT Math Multiple-Choice Test 2
- PSAT Math Multiple-Choice Test 3
- PSAT Math Multiple-Choice Test 4
- PSAT Math Multiple-Choice Test 5
- PSAT Math Multiple-Choice Test 6
- PSAT Math Multiple-Choice Test 7
- PSAT Math Multiple-Choice Test 8
- PSAT Math Multiple-Choice Test 9
- PSAT Math Multiple-Choice Test 10
- PSAT Math Multiple-Choice Test 11
- PSAT Math Multiple-Choice Test 12
- PSAT Math Multiple-Choice Test 13
- PSAT Math Multiple-Choice Test 14
- PSAT Math Multiple-Choice Test 15
- PSAT Math Multiple-Choice Test 16
- PSAT Math Multiple-Choice Test 17
- PSAT Math Multiple-Choice Test 18
- PSAT Math Multiple-Choice Test 19
- PSAT Math Multiple-Choice Test 20
- PSAT Math Multiple-Choice Test 21
- PSAT Math Multiple-Choice Test 22
- PSAT Math Multiple-Choice Test 23
- PSAT Math Multiple-Choice Test 24
- PSAT Math Multiple-Choice Test 25