PSAT Math Multiple-Choice Question 240: Answer and Explanation
Question: 240
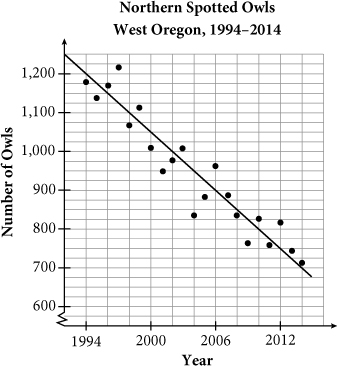
The United States Fish and Wildlife Service classifies animals whose populations are at low levels as either threatened or endangered. Endangered species are animals that are currently on the brink of extinction, whereas threatened species have a high probability of being on the brink in the near future. Since 1990, the Northern Spotted Owl has been listed as threatened. The figure above shows the populations of the Northern Spotted Owl in a certain region in Oregon from 1994 to 2014. Based on the line of best fit shown in the figure, which of the following values most accurately reflects the average change per year in the number of Northern Spotted Owls?
- A. - 25
- B. - 0.04
- C. 0.04
- D. 25
Correct Answer: A
Explanation:
A
Difficulty: Medium
Category: Problem Solving and Data Analysis/Scatterplots
Getting to the Answer: Examine the graph, paying careful attention to units and labels. Here, the years increase by 2 for each grid line and the number of owls by 25. The average change per year is the same as the slope of the line of best fit. Find the slope of the line of best fit using the slope formula,  , and any two points that lie on (or very close to) the line. Using the two endpoints of the data, (1994, 1,200) and (2014, 700), the average change per year is
 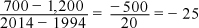 , which is (A). Pay careful attention to the sign of the answer—the number of owls is decreasing, so the rate of change is negative.
Test Information
- Use your browser's back button to return to your test results.
- Do more Math Multiple-Choice Tests tests.
More Tests
- PSAT Math Multiple-Choice Test 1
- PSAT Math Multiple-Choice Test 2
- PSAT Math Multiple-Choice Test 3
- PSAT Math Multiple-Choice Test 4
- PSAT Math Multiple-Choice Test 5
- PSAT Math Multiple-Choice Test 6
- PSAT Math Multiple-Choice Test 7
- PSAT Math Multiple-Choice Test 8
- PSAT Math Multiple-Choice Test 9
- PSAT Math Multiple-Choice Test 10
- PSAT Math Multiple-Choice Test 11
- PSAT Math Multiple-Choice Test 12
- PSAT Math Multiple-Choice Test 13
- PSAT Math Multiple-Choice Test 14
- PSAT Math Multiple-Choice Test 15
- PSAT Math Multiple-Choice Test 16
- PSAT Math Multiple-Choice Test 17
- PSAT Math Multiple-Choice Test 18
- PSAT Math Multiple-Choice Test 19
- PSAT Math Multiple-Choice Test 20
- PSAT Math Multiple-Choice Test 21
- PSAT Math Multiple-Choice Test 22
- PSAT Math Multiple-Choice Test 23
- PSAT Math Multiple-Choice Test 24
- PSAT Math Multiple-Choice Test 25