PSAT Math Multiple-Choice Practice Question 211
Question: 211
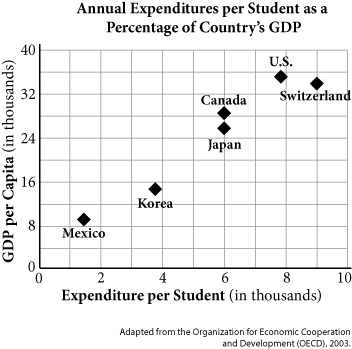
A student looked at the graph above and determined based on the data that spending more money per student causes the gross domestic product (GDP) to increase. Which of the following statements is true?
Correct Answer: D
Explanation:
D
Difficulty: Medium
Category: Problem Solving and Data Analysis/Statistics and Probability
Getting to the Answer: The two variables are certainly correlated—as one goes up, the other goes up. A linear regression model would fit the data fairly well, so you can eliminate (C). The spending is graphed on the x-axis, so it is the independent variable and therefore does not depend on the GDP, graphed on the y-axis, so you can eliminate (B) as well. The data does show that as spending on students increases, so does the GDP, but this is simply correlation, not causation. Without additional data, no statements can be made about whether spending more on students is the reason for the increased GDP, so (D) is correct.
More Tests
- PSAT Math Multiple-Choice Test 1
- PSAT Math Multiple-Choice Test 2
- PSAT Math Multiple-Choice Test 3
- PSAT Math Multiple-Choice Test 4
- PSAT Math Multiple-Choice Test 5
- PSAT Math Multiple-Choice Test 6
- PSAT Math Multiple-Choice Test 7
- PSAT Math Multiple-Choice Test 8
- PSAT Math Multiple-Choice Test 9
- PSAT Math Multiple-Choice Test 10
- PSAT Math Multiple-Choice Test 11
- PSAT Math Multiple-Choice Test 12
- PSAT Math Multiple-Choice Test 13
- PSAT Math Multiple-Choice Test 14
- PSAT Math Multiple-Choice Test 15
- PSAT Math Multiple-Choice Test 16
- PSAT Math Multiple-Choice Test 17
- PSAT Math Multiple-Choice Test 18
- PSAT Math Multiple-Choice Test 19
- PSAT Math Multiple-Choice Test 20
- PSAT Math Multiple-Choice Test 21
- PSAT Math Multiple-Choice Test 22
- PSAT Math Multiple-Choice Test 23
- PSAT Math Multiple-Choice Test 24
- PSAT Math Multiple-Choice Test 25