PSAT Math Multiple-Choice Question 199: Answer and Explanation
Question: 199
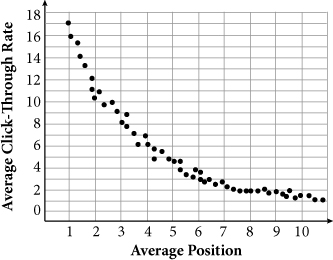
The figure above represents a click-through rate curve, which shows the relationship between a search result position in a list of Internet search results and the number of people who clicked on advertisements on that result's page. Which of the following regression types would be the best model for this data?
- A. A linear function
- B. A quadratic function
- C. A polynomial function
- D. An exponential function
Correct Answer: D
Explanation:
D
Difficulty: Medium
Category: Problem Solving and Data Analysis/-Scatterplots
Getting to the Answer: You aren't given much information to go on except the shape of the graph, so you'll need to think about what the shape means. Remember, linear functions increase at a constant rate, exponential functions increase at either an increasing or decreasing rate, gradually at first and then more quickly or vice versa, and quadratics and polynomials reverse direction one or more times. The graph begins by decreasing extremely quickly, but then it almost (but not quite) levels off. Therefore, it can't be linear, and because it doesn't change direction, an exponential function, (D), would be the best model for the data.
Test Information
- Use your browser's back button to return to your test results.
- Do more Math Multiple-Choice Tests tests.
More Tests
- PSAT Math Multiple-Choice Test 1
- PSAT Math Multiple-Choice Test 2
- PSAT Math Multiple-Choice Test 3
- PSAT Math Multiple-Choice Test 4
- PSAT Math Multiple-Choice Test 5
- PSAT Math Multiple-Choice Test 6
- PSAT Math Multiple-Choice Test 7
- PSAT Math Multiple-Choice Test 8
- PSAT Math Multiple-Choice Test 9
- PSAT Math Multiple-Choice Test 10
- PSAT Math Multiple-Choice Test 11
- PSAT Math Multiple-Choice Test 12
- PSAT Math Multiple-Choice Test 13
- PSAT Math Multiple-Choice Test 14
- PSAT Math Multiple-Choice Test 15
- PSAT Math Multiple-Choice Test 16
- PSAT Math Multiple-Choice Test 17
- PSAT Math Multiple-Choice Test 18
- PSAT Math Multiple-Choice Test 19
- PSAT Math Multiple-Choice Test 20
- PSAT Math Multiple-Choice Test 21
- PSAT Math Multiple-Choice Test 22
- PSAT Math Multiple-Choice Test 23
- PSAT Math Multiple-Choice Test 24
- PSAT Math Multiple-Choice Test 25