PSAT Math Multiple-Choice Question 195: Answer and Explanation
Question: 195
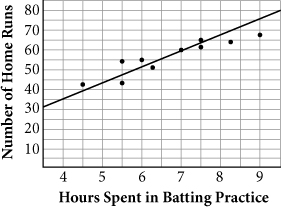
The scatterplot above shows data collected from 10 major league baseball players comparing the average weekly time each one spent in batting practice and the number of home runs he hit in a single season. The line of best fit for the data is also shown. What does the slope of the line represent in this context?
- A. The estimated time spent in batting practice by a player who hits zero home runs
- B. The estimated number of single-season home runs hit by a player who spends zero hours in batting practice
- C. The estimated increase in time that a player spends in batting practice for each home run that he hits in a single season
- D. The estimated increase in the number of single-season home runs hit by a player for each hour he spends in batting practice
Correct Answer: D
Explanation:
D
Difficulty: Easy
Category: Problem Solving and Data Analysis/-Scatterplots
Getting to the Answer: Graphically, slope is the ratio of the change in the y-values (rise) to the change in the x-values (run). In a real-world scenario, this is the same as the unit rate. In this context, the rise describes the change in the number of home runs hit in a single season, and the run describes the change in the number of hours a player spends in batting practice. Thus, the unit rate, or slope, represents the estimated increase (since the data trends upward) in the number of single-season home runs hit by a player for each hour he spends in batting practice. (D) is correct.
Test Information
- Use your browser's back button to return to your test results.
- Do more Math Multiple-Choice Tests tests.
More Tests
- PSAT Math Multiple-Choice Test 1
- PSAT Math Multiple-Choice Test 2
- PSAT Math Multiple-Choice Test 3
- PSAT Math Multiple-Choice Test 4
- PSAT Math Multiple-Choice Test 5
- PSAT Math Multiple-Choice Test 6
- PSAT Math Multiple-Choice Test 7
- PSAT Math Multiple-Choice Test 8
- PSAT Math Multiple-Choice Test 9
- PSAT Math Multiple-Choice Test 10
- PSAT Math Multiple-Choice Test 11
- PSAT Math Multiple-Choice Test 12
- PSAT Math Multiple-Choice Test 13
- PSAT Math Multiple-Choice Test 14
- PSAT Math Multiple-Choice Test 15
- PSAT Math Multiple-Choice Test 16
- PSAT Math Multiple-Choice Test 17
- PSAT Math Multiple-Choice Test 18
- PSAT Math Multiple-Choice Test 19
- PSAT Math Multiple-Choice Test 20
- PSAT Math Multiple-Choice Test 21
- PSAT Math Multiple-Choice Test 22
- PSAT Math Multiple-Choice Test 23
- PSAT Math Multiple-Choice Test 24
- PSAT Math Multiple-Choice Test 25