PSAT Math Multiple-Choice Question 190: Answer and Explanation
Question: 190
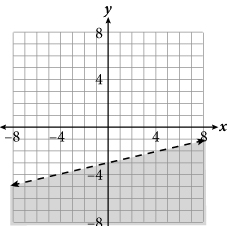
The solution to which inequality is represented in the graph above?
- A.

- B.

- C.

- D.

Correct Answer: A
Explanation:
A
Difficulty: Medium
Category: Heart of Algebra/Inequalities
Getting to the Answer: Don't answer this question too quickly. The shading is below the line, but that does not necessarily mean that the symbol in the equation will be the less than symbol (<). Start by writing the equation of the dashed line shown in the graph in slope-intercept form. Then, use the shading to determine the correct inequality symbol. The slope of the line shown in the graph is  and the y-intercept is - 3, so the equation of the dashed line is
  . The graph is shaded below the boundary line, so use the < symbol. When written in slope-intercept form, the inequality is
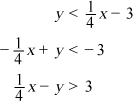
  . The inequalities in the answer choices are given in standard form (Ax + By = C), so rewrite your answer in this form. Don't forget to reverse the inequality symbol if you multiply or divide by a negative number:
Choice (A) is correct.
Test Information
- Use your browser's back button to return to your test results.
- Do more Math Multiple-Choice Tests tests.
More Tests
- PSAT Math Multiple-Choice Test 1
- PSAT Math Multiple-Choice Test 2
- PSAT Math Multiple-Choice Test 3
- PSAT Math Multiple-Choice Test 4
- PSAT Math Multiple-Choice Test 5
- PSAT Math Multiple-Choice Test 6
- PSAT Math Multiple-Choice Test 7
- PSAT Math Multiple-Choice Test 8
- PSAT Math Multiple-Choice Test 9
- PSAT Math Multiple-Choice Test 10
- PSAT Math Multiple-Choice Test 11
- PSAT Math Multiple-Choice Test 12
- PSAT Math Multiple-Choice Test 13
- PSAT Math Multiple-Choice Test 14
- PSAT Math Multiple-Choice Test 15
- PSAT Math Multiple-Choice Test 16
- PSAT Math Multiple-Choice Test 17
- PSAT Math Multiple-Choice Test 18
- PSAT Math Multiple-Choice Test 19
- PSAT Math Multiple-Choice Test 20
- PSAT Math Multiple-Choice Test 21
- PSAT Math Multiple-Choice Test 22
- PSAT Math Multiple-Choice Test 23
- PSAT Math Multiple-Choice Test 24
- PSAT Math Multiple-Choice Test 25