PSAT Math Multiple-Choice Practice Question 189
Question: 189
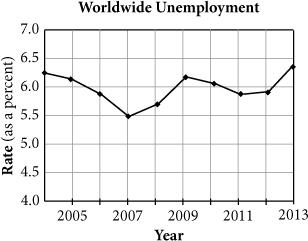
The figure above shows worldwide unemployment rates from 2004 to 2013. Which of the following statements is true?
Correct Answer: C
Explanation:
C
Difficulty: Medium
Category: Passport to Advanced Math/Functions
Getting to the Answer: A graph is decreasing when the slope is negative; it is increasing when the slope is positive. Eliminate (A) because there are some segments on the graph that have a positive slope. Eliminate (B) because the slope is negative, not positive, between 2009 and 2010. Choice (C) is correct because the slope is negative for each segment between 2004 and 2007 and also between 2009 and 2011.
More Tests
- PSAT Math Multiple-Choice Test 1
- PSAT Math Multiple-Choice Test 2
- PSAT Math Multiple-Choice Test 3
- PSAT Math Multiple-Choice Test 4
- PSAT Math Multiple-Choice Test 5
- PSAT Math Multiple-Choice Test 6
- PSAT Math Multiple-Choice Test 7
- PSAT Math Multiple-Choice Test 8
- PSAT Math Multiple-Choice Test 9
- PSAT Math Multiple-Choice Test 10
- PSAT Math Multiple-Choice Test 11
- PSAT Math Multiple-Choice Test 12
- PSAT Math Multiple-Choice Test 13
- PSAT Math Multiple-Choice Test 14
- PSAT Math Multiple-Choice Test 15
- PSAT Math Multiple-Choice Test 16
- PSAT Math Multiple-Choice Test 17
- PSAT Math Multiple-Choice Test 18
- PSAT Math Multiple-Choice Test 19
- PSAT Math Multiple-Choice Test 20
- PSAT Math Multiple-Choice Test 21
- PSAT Math Multiple-Choice Test 22
- PSAT Math Multiple-Choice Test 23
- PSAT Math Multiple-Choice Test 24
- PSAT Math Multiple-Choice Test 25