PSAT Math Multiple-Choice Question 182: Answer and Explanation
Question: 182
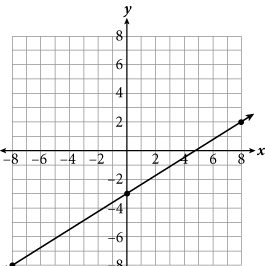
What is the average rate of change for the line graphed in the figure above?
- A.

- B.

- C.

- D.

Correct Answer: B
Explanation:
B
Difficulty: Easy
Category: Heart of Algebra/Linear Equations
Getting to the Answer: The average rate of change for a linear function is the same as the slope of the line. Find the slope of the line by either using the slope formula or by counting the rise and the run from one point to the next. If you start at (0, - 3), the line rises 5 units and runs 8 units to get to (8, 2), so the slope, or average rate of change, is  . Choice (B) is correct.
Test Information
- Use your browser's back button to return to your test results.
- Do more Math Multiple-Choice Tests tests.
More Tests
- PSAT Math Multiple-Choice Test 1
- PSAT Math Multiple-Choice Test 2
- PSAT Math Multiple-Choice Test 3
- PSAT Math Multiple-Choice Test 4
- PSAT Math Multiple-Choice Test 5
- PSAT Math Multiple-Choice Test 6
- PSAT Math Multiple-Choice Test 7
- PSAT Math Multiple-Choice Test 8
- PSAT Math Multiple-Choice Test 9
- PSAT Math Multiple-Choice Test 10
- PSAT Math Multiple-Choice Test 11
- PSAT Math Multiple-Choice Test 12
- PSAT Math Multiple-Choice Test 13
- PSAT Math Multiple-Choice Test 14
- PSAT Math Multiple-Choice Test 15
- PSAT Math Multiple-Choice Test 16
- PSAT Math Multiple-Choice Test 17
- PSAT Math Multiple-Choice Test 18
- PSAT Math Multiple-Choice Test 19
- PSAT Math Multiple-Choice Test 20
- PSAT Math Multiple-Choice Test 21
- PSAT Math Multiple-Choice Test 22
- PSAT Math Multiple-Choice Test 23
- PSAT Math Multiple-Choice Test 24
- PSAT Math Multiple-Choice Test 25