PSAT Math Multiple-Choice Practice Question 146
Question: 146
For 32 cars that were identical when new, the scatterplot above shows the number of years of ownership and the selling price when the first owner sold the car. The line of best fit is also shown.
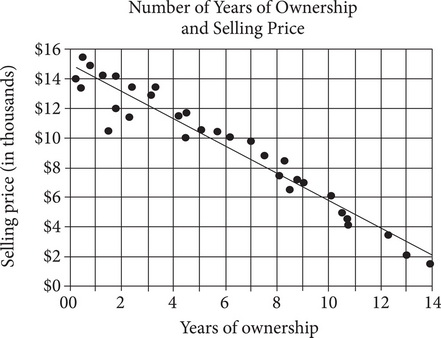
For the car that was sold after exactly 7 years of ownership, the actual selling price of the car was approximately how much more than the selling price predicted by the line of best fit?
Correct Answer: B
Explanation:
B
The question asks how much more the actual selling price was compared to that predicted by the line of best fit for the car that was sold after it was owned for exactly 7 years. Find 7 on the horizontal axis and trace up to the point and the line of best fit. They lie between two gridlines on the vertical axis. Since each interval is $2,000, the difference must be less than $2,000. Eliminate (C) and (D). Since the difference makes up more than half the interval, the difference must be more than $1,000. Eliminate (A). The correct answer is (B).
More Tests
- PSAT Math Multiple-Choice Test 1
- PSAT Math Multiple-Choice Test 2
- PSAT Math Multiple-Choice Test 3
- PSAT Math Multiple-Choice Test 4
- PSAT Math Multiple-Choice Test 5
- PSAT Math Multiple-Choice Test 6
- PSAT Math Multiple-Choice Test 7
- PSAT Math Multiple-Choice Test 8
- PSAT Math Multiple-Choice Test 9
- PSAT Math Multiple-Choice Test 10
- PSAT Math Multiple-Choice Test 11
- PSAT Math Multiple-Choice Test 12
- PSAT Math Multiple-Choice Test 13
- PSAT Math Multiple-Choice Test 14
- PSAT Math Multiple-Choice Test 15
- PSAT Math Multiple-Choice Test 16
- PSAT Math Multiple-Choice Test 17
- PSAT Math Multiple-Choice Test 18
- PSAT Math Multiple-Choice Test 19
- PSAT Math Multiple-Choice Test 20
- PSAT Math Multiple-Choice Test 21
- PSAT Math Multiple-Choice Test 22
- PSAT Math Multiple-Choice Test 23
- PSAT Math Multiple-Choice Test 24
- PSAT Math Multiple-Choice Test 25