PSAT Math Multiple-Choice Practice Question 145
Question: 145
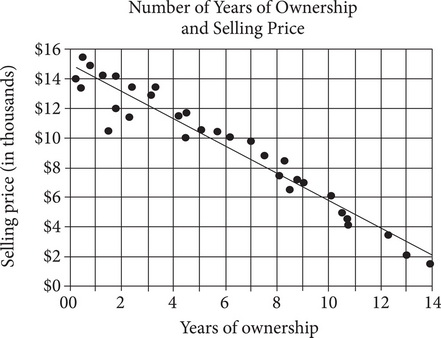
For 32 cars that were identical when new, the scatterplot above shows the number of years of ownership and the selling price when the first owner sold the car. The line of best fit is also shown.
Which of the following statements about the relationship between years of ownership and selling price is true?
Correct Answer: A
Explanation:
A
The question asks for the relationship between years of ownership and selling price. Look at the graph. There is clearly a downward trend in both the scatterplot and the line of best fit. Therefore, this is a negative correlation: as one variable increases, the other variable decreases. Eliminate (B), (C), and (D), which do not describe such a relationship. The correct answer is (A).
More Tests
- PSAT Math Multiple-Choice Test 1
- PSAT Math Multiple-Choice Test 2
- PSAT Math Multiple-Choice Test 3
- PSAT Math Multiple-Choice Test 4
- PSAT Math Multiple-Choice Test 5
- PSAT Math Multiple-Choice Test 6
- PSAT Math Multiple-Choice Test 7
- PSAT Math Multiple-Choice Test 8
- PSAT Math Multiple-Choice Test 9
- PSAT Math Multiple-Choice Test 10
- PSAT Math Multiple-Choice Test 11
- PSAT Math Multiple-Choice Test 12
- PSAT Math Multiple-Choice Test 13
- PSAT Math Multiple-Choice Test 14
- PSAT Math Multiple-Choice Test 15
- PSAT Math Multiple-Choice Test 16
- PSAT Math Multiple-Choice Test 17
- PSAT Math Multiple-Choice Test 18
- PSAT Math Multiple-Choice Test 19
- PSAT Math Multiple-Choice Test 20
- PSAT Math Multiple-Choice Test 21
- PSAT Math Multiple-Choice Test 22
- PSAT Math Multiple-Choice Test 23
- PSAT Math Multiple-Choice Test 24
- PSAT Math Multiple-Choice Test 25