PSAT Math Multiple-Choice Question 118: Answer and Explanation
Question: 118
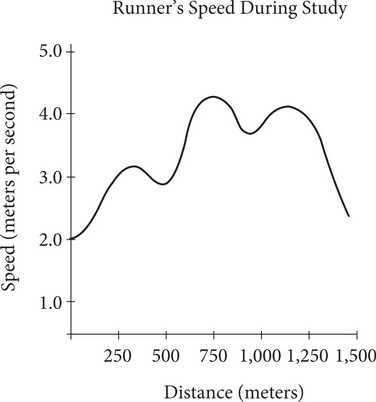
A company that produces sports drinks wants to test the effects of its new electrolyte-infused water on athletic performance. One of the runners in the study drinks a bottle of the company's new water before his 1,500-meter run and keeps track of his speed throughout the run. The figure below graphs his speed, in meters per second, on the y-axis and the distance, in meters, along the x-axis.
Based on the graph, which of the following statements is true?
- A. The x-intercept of the graph represents the runner's starting speed.
- B. The runner's slowest speed during his run occurs during the last 250 meters.
- C. The runner increases his speed steadily until he reaches a distance of 1,000 meters.
- D. The runner reaches his fastest speed at a distance of 750 meters.
Correct Answer: D
Explanation:
D
The question asks for a true statement based on the graph. The graph gives speed on the vertical axis and distance on the horizontal axis. Read each answer choice carefully and use Process of Elimination. Choice (A) refers to the x-intercept, but the graph never touches the horizontal x-axis; eliminate (A). Choice (B) states that the slowest speed is in the last 250 meters, but the slowest speed is at the beginning of the graph; eliminate (B). Choice (C) states that the runner's speed increases steadily during the first 1,000 meters, but there is a decrease in speed between 250 and 500 meters; eliminate (C). Choice (D) states that the fastest speed is at 750 meters, and the peak of the graph is at that point along the horizontal axis. The correct answer is (D).
Test Information
- Use your browser's back button to return to your test results.
- Do more Math Multiple-Choice Tests tests.
More Tests
- PSAT Math Multiple-Choice Test 1
- PSAT Math Multiple-Choice Test 2
- PSAT Math Multiple-Choice Test 3
- PSAT Math Multiple-Choice Test 4
- PSAT Math Multiple-Choice Test 5
- PSAT Math Multiple-Choice Test 6
- PSAT Math Multiple-Choice Test 7
- PSAT Math Multiple-Choice Test 8
- PSAT Math Multiple-Choice Test 9
- PSAT Math Multiple-Choice Test 10
- PSAT Math Multiple-Choice Test 11
- PSAT Math Multiple-Choice Test 12
- PSAT Math Multiple-Choice Test 13
- PSAT Math Multiple-Choice Test 14
- PSAT Math Multiple-Choice Test 15
- PSAT Math Multiple-Choice Test 16
- PSAT Math Multiple-Choice Test 17
- PSAT Math Multiple-Choice Test 18
- PSAT Math Multiple-Choice Test 19
- PSAT Math Multiple-Choice Test 20
- PSAT Math Multiple-Choice Test 21
- PSAT Math Multiple-Choice Test 22
- PSAT Math Multiple-Choice Test 23
- PSAT Math Multiple-Choice Test 24
- PSAT Math Multiple-Choice Test 25