PSAT Math Grid-Ins Question 88: Answer and Explanation
Question: 88
The Kp Index measures the energy added to Earth's magnetic field from the Sun on a scale of 0–9, with 1 representing a solar calm and 5 or more indicating a magnetic storm, or solar flare. The magnetic fluctuations are measured in three-hour intervals (12 a.m.–3 a.m., 3 a.m.–6 a.m., and so on). The bar graph below shows the measurements for a five-day period in September.
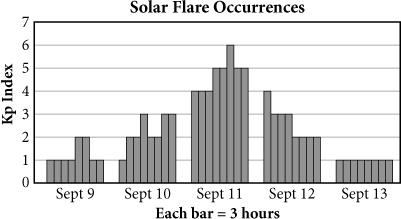
If a single 3-hour time period between September 9 and September 13 (including the start and end dates) is chosen at random, what is the probability that a solar flare occurred during that time?
Correct Answer: 5/40 or 1/8 or .125
Explanation:
5/40 or 1/8 or .125
Difficulty: Medium
Category: Probability
Getting to the Answer: Probability compares the number of desired outcomes (number of 3-hour periods with a Kp index greater than or equal to 5) to the total number of possible outcomes (total number of 3-hour periods between September 9 and September 13).
Count the number of bars in the graph that have a height of 5 or more—there are 5. Count the total number of bars—there are 8 for each of the 5 days, for a total of 40. This means there were five 3-hour periods out of 40 during which a solar flare occurred, so the probability of randomly selecting one of those periods is  . You could also grid in the answer as .125.
Test Information
- Use your browser's back button to return to your test results.
- Do more Math Grid-Ins Tests tests.
More Tests
- PSAT Math Grid-Ins Test 1
- PSAT Math Grid-Ins Test 2
- PSAT Math Grid-Ins Test 3
- PSAT Math Grid-Ins Test 4
- PSAT Math Grid-Ins Test 5
- PSAT Math Grid-Ins Test 6
- PSAT Math Grid-Ins Test 7
- PSAT Math Grid-Ins Test 8
- PSAT Math Grid-Ins Test 9
- PSAT Math Grid-Ins Test 10
- PSAT Math Grid-Ins Test 11
- PSAT Math Grid-Ins Test 12