PSAT Math Grid-Ins Question 87: Answer and Explanation
Question: 87
The Kp Index measures the energy added to Earth's magnetic field from the Sun on a scale of 0–9, with 1 representing a solar calm and 5 or more indicating a magnetic storm, or solar flare. The magnetic fluctuations are measured in three-hour intervals (12 a.m.–3 a.m., 3 a.m.–6 a.m., and so on). The bar graph below shows the measurements for a five-day period in September.
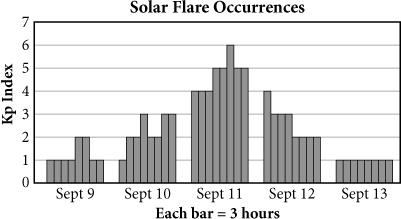
Based on the graph, a solar flare lasted for how many hours on September 11?
Correct Answer: 15
Explanation:
15
Difficulty: Easy
Category: Tables and Graphs
Getting to the Answer: Read the graph carefully, including the key at the bottom that tells you that each bar represents a 3-hour period. The question tells you that a Kp Index of 5 or more indicates a solar flare. On September 11, the graph shows 4 bars at a Kp Index of 5 and 1 bar at a Kp Index of 6, for a total of five 3-hour periods during which a solar flare occurred. This represents a total of 5 × 3 = 15 hours. Grid in 15.
Test Information
- Use your browser's back button to return to your test results.
- Do more Math Grid-Ins Tests tests.
More Tests
- PSAT Math Grid-Ins Test 1
- PSAT Math Grid-Ins Test 2
- PSAT Math Grid-Ins Test 3
- PSAT Math Grid-Ins Test 4
- PSAT Math Grid-Ins Test 5
- PSAT Math Grid-Ins Test 6
- PSAT Math Grid-Ins Test 7
- PSAT Math Grid-Ins Test 8
- PSAT Math Grid-Ins Test 9
- PSAT Math Grid-Ins Test 10
- PSAT Math Grid-Ins Test 11
- PSAT Math Grid-Ins Test 12