PSAT Math Grid-Ins Question 49: Answer and Explanation
Question: 49
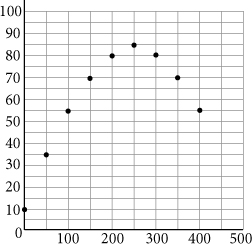
Nine data points were used to generate the scatterplot shown above. Assuming all whole number values for the data points, what is the maximum value in the range of the data?
Correct Answer: 85
Explanation:
85
Difficulty: Easy
Category: Problem Solving and Data Analysis/-Scatterplots
Getting to the Answer: The range of a set of data points is the set of outputs, which correspond to the y--values of the data points on the graph. To find the maximum value in the range of the data, look for the highest point on the graph, which is (250, 85). The y-value is 85, so 85 is the maximum value in the range.
Test Information
- Use your browser's back button to return to your test results.
- Do more Math Grid-Ins Tests tests.
More Tests
- PSAT Math Grid-Ins Test 1
- PSAT Math Grid-Ins Test 2
- PSAT Math Grid-Ins Test 3
- PSAT Math Grid-Ins Test 4
- PSAT Math Grid-Ins Test 5
- PSAT Math Grid-Ins Test 6
- PSAT Math Grid-Ins Test 7
- PSAT Math Grid-Ins Test 8
- PSAT Math Grid-Ins Test 9
- PSAT Math Grid-Ins Test 10
- PSAT Math Grid-Ins Test 11
- PSAT Math Grid-Ins Test 12