PSAT Math Grid-Ins Question 114: Answer and Explanation
Question: 114
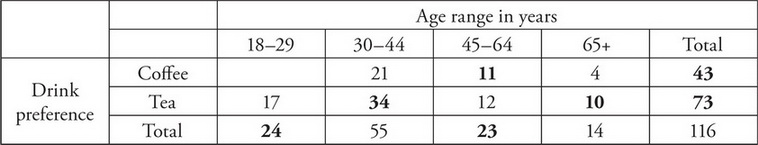
A restaurant surveyed its customers to determine which beverage was most popular with breakfast. Participants were required to choose either coffee or tea. The partially completed table below shows the breakdown by age of a sample of 116 people who responded to a survey on their drink preferences.
Breakdown of Customers’ Drink Preferences

Among all the people represented in the survey, 25.6% of the people who chose coffee as their preferred beverage were 45–64 years old. What is the total number of people ages 18–29 who voted for either coffee or tea in the survey?
Correct Answer: 24
Explanation:
24
The question asks for the number of people ages 18–29 who participated in a survey. This question is much longer and more complicated than Q25, so start with that question, filling in the table with one piece of information at a time. The information determined in Q25 is bolded in the table below.

This question states that 25.6% of the people who chose coffee as their preferred beverage were 45–64 years old. The total number of people who prefer coffee is 43, so 0.256(43) = 11 people ages 45–64 prefer coffee. There were 12 people ages 45–64 who prefer tea, so 11 + 12 = 23 people ages 45–64 surveyed in total. These numbers are bolded in the table below.

The total number of people surveyed is 116, so 116 – 14 – 23 – 55 = 24 people ages 18–29 surveyed in total. The completed table is shown below.
The correct answer is 24.
Test Information
- Use your browser's back button to return to your test results.
- Do more Math Grid-Ins Tests tests.
More Tests
- PSAT Math Grid-Ins Test 1
- PSAT Math Grid-Ins Test 2
- PSAT Math Grid-Ins Test 3
- PSAT Math Grid-Ins Test 4
- PSAT Math Grid-Ins Test 5
- PSAT Math Grid-Ins Test 6
- PSAT Math Grid-Ins Test 7
- PSAT Math Grid-Ins Test 8
- PSAT Math Grid-Ins Test 9
- PSAT Math Grid-Ins Test 10
- PSAT Math Grid-Ins Test 11
- PSAT Math Grid-Ins Test 12