PSAT Writing and Language Practice Question 209
Question: 209
Predicting Nature's Light Show
One of the most beautiful of nature's displays is the aurora borealis, commonly known as the Northern Lights. As 34 their informal name suggests, the best place to view this phenomenon 35 is the Northern Hemisphere. How far north one needs to be to witness auroras depends not on conditions here on Earth, but on the Sun. 36
As with hurricane season on Earth, the Sun 37 observes a cycle of storm activity, called the solar cycle, which lasts approximately 11 years. Also referred to as the sunspot cycle, this period is caused by the amount of magnetic flux that rises to the surface of the Sun, causing sunspots, or areas of intense magnetic activity. The magnetic energy is sometimes so great it causes a storm that explodes away from the Sun's surface in a solar flare.
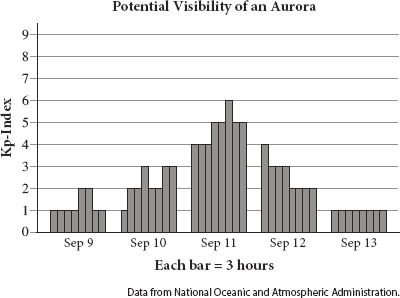
These powerful magnetic storms eject high-speed electrons and protons into space. Called a coronal mass ejection, this ejection is far more powerful than the hot gases the Sun constantly emits. The speed at which the atoms are shot away from the Sun is almost triple that of a normal solar wind. It takes this shot of energy one to three days to arrive at Earth's upper atmosphere. Once it arrives, it is captured by Earth's own magnetic field. It is this newly captured energy that causes the Northern Lights. 38 Scientists and interested amateurs in the Northern Hemisphere 39 use tools readily available to all in order to predict the likelihood of seeing auroras in their location at a specific time. One such tool is the Kp-Index, a number that determines the potential visibility of an aurora. The Kp-Index measures the energy added to Earth's magnetic field from the Sun on a scale of 0-9, with 1 representing a solar calm and 5 or more indicating a magnetic storm, or solar flare. The magnetic fluctuations are measured in three-hour intervals (12 a.m. to 3 a.m., 3 a.m. to 6 a.m., and so on) so that deviations can be factored in and accurate data can be presented. 40
Magnetometers, tools that measure the strength of Earth's magnetic field, are located around the world. When the energy from solar flares reaches Earth, the strength and direction of the energy 41 is recorded by these tools and analyzed by scientists at the National Oceanic and Atmospheric Administration, who calculate the difference between the average strength of the magnetic field and spikes due to solar flares. They plot this information on the Kp-Index and 42 update the public with information on viewing the auroras as well as other impacts solar flares may have on life on Earth.
43 While solar flares can sometimes have negative effects on our communications systems and weather patterns, the most common effect is also the most enchanting: a beautiful light show, such as the solar flare that took place from 44 3 p.m. to 6 p.m. on September 11.
Which choice competes the sentence with accurate data based on the graphic?
Correct Answer: D
Explanation:
D
Difficulty: Hard
Category: Graphs
Getting to the Answer: Reread paragraph 4 for information that will help you understand how to read the graphic. Use that information to calculate the precise start and end time for the solar flare as indicated in the graphic. The passage states that a solar flare is represented by any Kp-Index of 5 or higher. While there is one three-hour period where the Kp-Index reached 6, there is a consistent period where the chart shows readings of level 5 or higher. Choice (D) is the correct answer. This choice gives the complete time period showing a reading of level 5 or higher, according to the chart.