Digital PSAT Reading and Writing Practice Question 14: Answer and Explanation
Question: 14
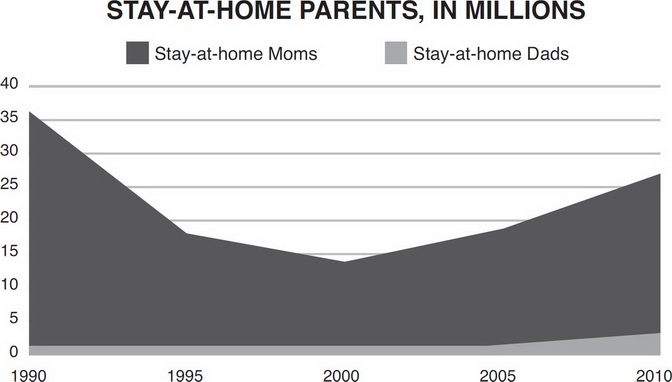
An often-overlooked change in a workforce evermore reliant on technology is the increasing number of employees who find themselves staying at home during the workday. __________________
Which choice most effectively uses data from the chart to complete the example?
- A. From 1990 to 2000, the number of stay-at-home moms declined, whereas the number of stay-at-home dads remained steady.
- B. From 1995 to 2005, the number of stay-at-home moms increased slightly, whereas the number of stay-at-home dads remained steady.
- C. From 1990 to 2010, the number of stay-at-home moms somewhat declined, whereas the number of stay-at-home dads slightly increased.
- D. From 2000 to 2010, the number of stay-at-home moms and stay-at-home dads both increased.
Correct Answer: D
Explanation:
(D) The correct answer is (D) because in 2000, both the number of stay-at-home moms and the number of stay-at-home dads were lower than they were in 2010; this data supports the claim in the previous sentence that there is an "increasing number of employees who find themselves staying at home during the workday." Choices (A), (B), and (C) make accurate statements based on the data in the graph, but they would not support the claim made in the previous sentence.
Test Information
- Use your browser's back button to return to your test results.
- Do more Digital PSAT Reading and Writing Tests tests.
More Tests
- Digital PSAT Reading and Writing Test 1
- Digital PSAT Reading and Writing Test 2
- Digital PSAT Reading and Writing Test 3
- Digital PSAT Reading and Writing Test 4
- Digital PSAT Reading and Writing Test 5
- Digital PSAT Reading and Writing Test 6
- Digital PSAT Reading and Writing Test 7
- Digital PSAT Reading and Writing Test 8
- Digital PSAT Reading and Writing Test 9
- Digital PSAT Reading and Writing Test 10
- Digital PSAT Reading and Writing Test 11
- Digital PSAT Reading and Writing Test 12
- Digital PSAT Reading and Writing Test 13
- Digital PSAT Reading and Writing Test 14
- Digital PSAT Reading and Writing Test 15
- Digital PSAT Reading and Writing Test 16
- Digital PSAT Reading and Writing Test 17
- Digital PSAT Reading and Writing Test 18
- Digital PSAT Reading and Writing Test 19
- Digital PSAT Reading and Writing Test 20