Digital PSAT Math Practice Question 95: Answer and Explanation
Question: 95
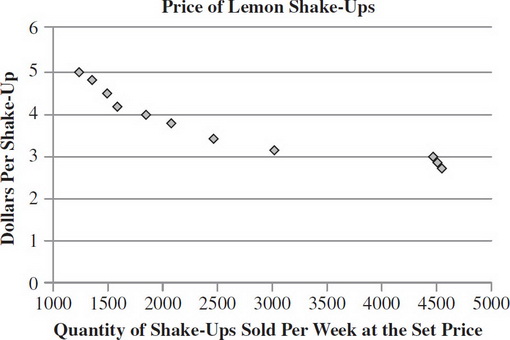
If you were to graph dollars per shake-up along the x-axis and quantity of shake-ups sold per week at the set price on the y-axis, which of the following would be a property of the function between the values of 3 and 5 dollars?
- A. It would be a decreasing exponential function.
- B. It would be an increasing exponential function.
- C. It would be a decreasing linear function.
- D. It would be an increasing linear function.
Correct Answer: A
Explanation:
(A) We can see from the negative slope that as the quantity of shake-ups increases, price decreases. Therefore, we know that the function will be decreasing, eliminating choices (B) and (D). We can also see that the slope isn't constant. Therefore, it can't be linear, as in choice (C). The graph starts off fairly steep and then it becomes less steep, consistent with exponential decay, as in choice (A).
Test Information
- Use your browser's back button to return to your test results.
- Do more Digital PSAT Math Tests tests.
More Tests
- Digital PSAT Math Practice Test 1
- Digital PSAT Math Practice Test 2
- Digital PSAT Math Practice Test 3
- Digital PSAT Math Practice Test 4
- Digital PSAT Math Practice Test 5
- Digital PSAT Math Practice Test 6
- Digital PSAT Math Practice Test 7
- Digital PSAT Math Practice Test 8
- Digital PSAT Math Practice Test 9
- Digital PSAT Math Practice Test 10
- Digital PSAT Math Practice Test 11
- Digital PSAT Math Practice Test 12
- Digital PSAT Math Practice Test 13
- Digital PSAT Math Practice Test 14
- Digital PSAT Math Practice Test 15