Digital PSAT Math Practice Question 22: Answer and Explanation
Question: 22
The graph below gives the current GPA of every one of the 389 students at County High School.
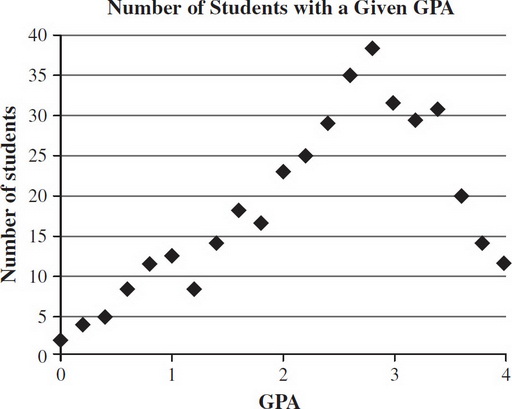
Which of these values of the GPA for the students portrayed in the graph is between 2 and 3?
I. Mean
II. Median
III. Mode
- A. I only
- B. II only
- C. I and II only
- D. I, II, and III
Correct Answer: D
Explanation:
(D) Since there is a large cluster of students with GPAs between 2 and 3, it is possible to estimate that the mean and median will fall in that range. The most frequent value, the mode, will also be in that range since the greatest number of students with a particular GPA is between 2 and 3.
Test Information
- Use your browser's back button to return to your test results.
- Do more Digital PSAT Math Tests tests.
More Tests
- Digital PSAT Math Practice Test 1
- Digital PSAT Math Practice Test 2
- Digital PSAT Math Practice Test 3
- Digital PSAT Math Practice Test 4
- Digital PSAT Math Practice Test 5
- Digital PSAT Math Practice Test 6
- Digital PSAT Math Practice Test 7
- Digital PSAT Math Practice Test 8
- Digital PSAT Math Practice Test 9
- Digital PSAT Math Practice Test 10
- Digital PSAT Math Practice Test 11
- Digital PSAT Math Practice Test 12
- Digital PSAT Math Practice Test 13
- Digital PSAT Math Practice Test 14
- Digital PSAT Math Practice Test 15