Digital PSAT Math Practice Question 19: Answer and Explanation
Question: 19
A marine biologist has conducted research into the population of blue whales over the past few decades. The estimated global blue whale population is plotted against the given year in the graph below:
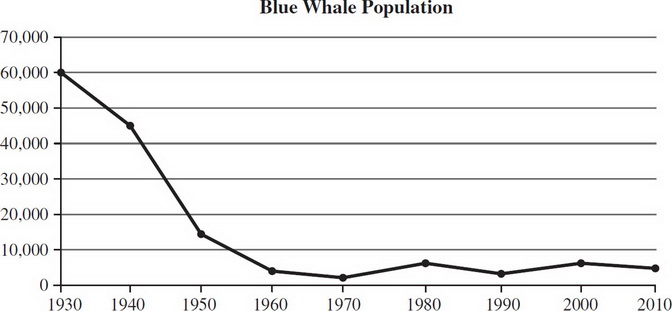
From 1940 until 1970, the best-fit equation for the values of the blue whale population has which general characteristic?
- A. Linear decay
- B. Linear growth
- C. Exponential decay
- D. Exponential growth
Correct Answer: C
Explanation:
(C) Between 1940 and 1970, the blue whale population is decreasing and the function has a substantial curve. So the graph shows exponential decay. Note that if the decay were linear, the graph would have gone down in a straight line.
Test Information
- Use your browser's back button to return to your test results.
- Do more Digital PSAT Math Tests tests.
More Tests
- Digital PSAT Math Practice Test 1
- Digital PSAT Math Practice Test 2
- Digital PSAT Math Practice Test 3
- Digital PSAT Math Practice Test 4
- Digital PSAT Math Practice Test 5
- Digital PSAT Math Practice Test 6
- Digital PSAT Math Practice Test 7
- Digital PSAT Math Practice Test 8
- Digital PSAT Math Practice Test 9
- Digital PSAT Math Practice Test 10
- Digital PSAT Math Practice Test 11
- Digital PSAT Math Practice Test 12
- Digital PSAT Math Practice Test 13
- Digital PSAT Math Practice Test 14
- Digital PSAT Math Practice Test 15