Digital PSAT Math Practice Question 184: Answer and Explanation
Question: 184
The data are collected from a survey of 500 randomly selected people in the United States. The researcher asked participants their ages and the type of social media they use the most frequently: video sharing, photo sharing, text sharing, or none. The goal of the researcher was to determine the general characteristics of social media use by different age groups throughout the United States.
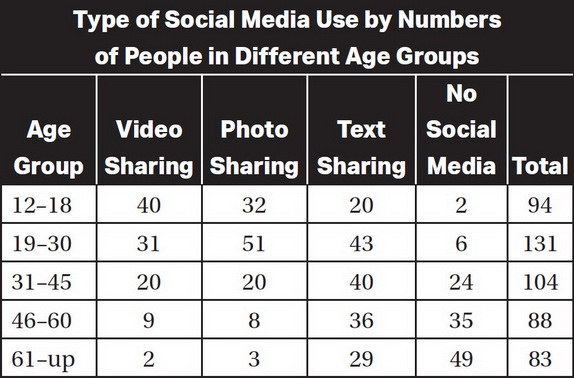
If one were to create a graph with age groupings (from younger to older) as the variable along the x-axis and percentage of group members who use video sharing (from smaller to larger) along the y-axis, what would be the relationship portrayed by the data?
- A. Positive correlation
- B. Negative correlation
- C. Equivalence
- D. Exponentially inverse
Correct Answer: B
Explanation:
(B) As the age groups gradually increase in value (from 12 through 61+), the number of group members using video sharing steadily decreases (from 40 to 2). A negative correlation is defined as the relationship between two variables such that when one variable increases, the other variable decreases. So the relationship between age groups and percentage of group members using video sharing can best be described as a negative correlation.
A positive correlation is when the variables increase with one another. Equivalence simply means the variables are equal. An exponentially inverse relationship means that as one variable increases, the other decreases at an exponential rate. The decrease in video sharing is relatively steady, so the terms cannot be described as having an exponentially inverse relationship.
Test Information
- Use your browser's back button to return to your test results.
- Do more Digital PSAT Math Tests tests.
More Tests
- Digital PSAT Math Practice Test 1
- Digital PSAT Math Practice Test 2
- Digital PSAT Math Practice Test 3
- Digital PSAT Math Practice Test 4
- Digital PSAT Math Practice Test 5
- Digital PSAT Math Practice Test 6
- Digital PSAT Math Practice Test 7
- Digital PSAT Math Practice Test 8
- Digital PSAT Math Practice Test 9
- Digital PSAT Math Practice Test 10
- Digital PSAT Math Practice Test 11
- Digital PSAT Math Practice Test 12
- Digital PSAT Math Practice Test 13
- Digital PSAT Math Practice Test 14
- Digital PSAT Math Practice Test 15